

Process Summary for “GISCartography”
Topics Covered: ArcCatalog, manipulating cartographic data, selecting by attributes, exporting data to new layer, creating maps, map legends, multiple data frames
Deliverables: 3 Maps and Process Summary
· GISCarto1
1. Followed Steps in Lab: GIS and Cartography
2. Add datasets from ArcCatalog to ArcMap: World_Countries, Mex_boundary, and Americas_Admin
3. Save as: H:\Working Projects\GISCartography\GISCartography\Mexico_ndp.mxd
4. Layers Deselected: Mex_states, MEX_boundary, and World_Countries
5. Set Zoom
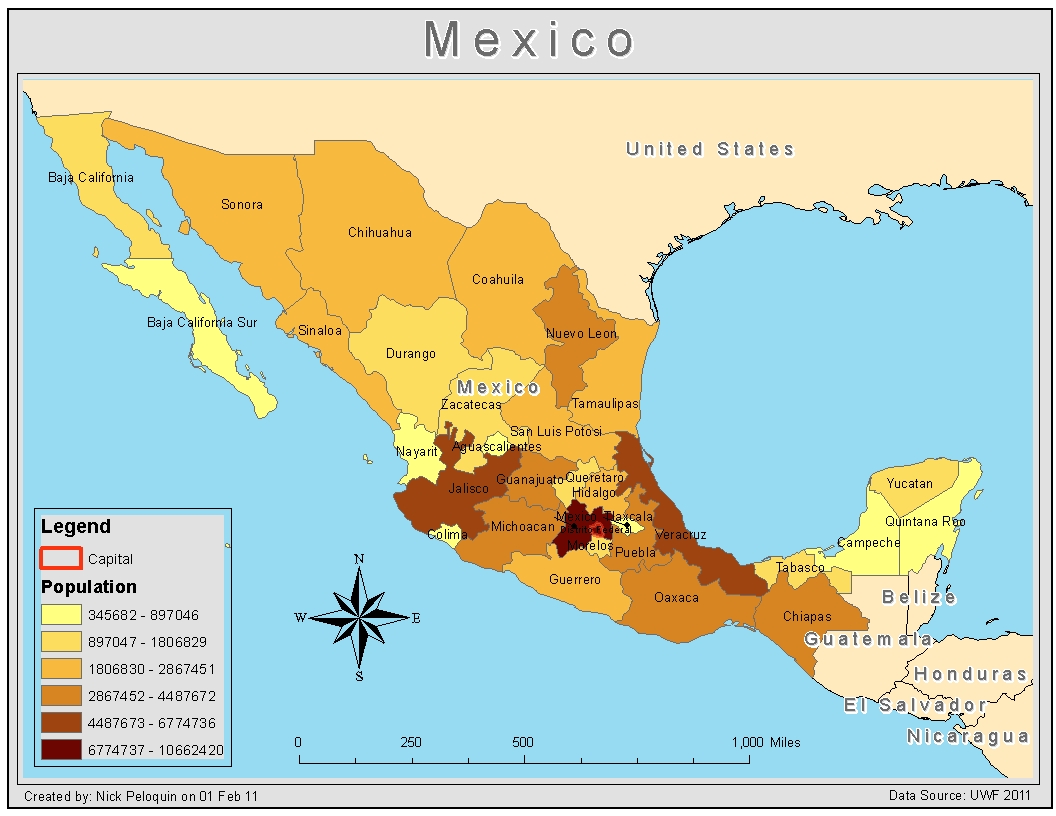
6. Add to Legend: Population
7. Add North: Size and Position
8. Add Neatline: Gap 5, Border 1.0, Background Grey 10%
9. Size and Position: Align to Center
10. Adjust Frames
11. Add Scale: Set Number of Divisions 4, Change Unit Divisions to Miles
12. Add Name and Date: Nick Peloquin 01 Feb 11, Size, Position, Font
13. Add Data Source: UWF 2011, Size, Position, Font
14. Turn on Labels Feature on Mex_states
15. Create Capital Layer
16. Export Map Document: H:\Finished Products\GISCartography\GISCarto_map1_ndp.jpg
· GISCarto2
1. Followed Steps in Lab: GIS and Cartography
2. Layers Selected: Urban Areas, Rivers, Railroads, Roads, Mex_Boundary, and World Countries
3. Change Title: Central Mexico Size, Position
4. Add Data Source: UWF 2011, 2007
5. Legend: Adjust Style
6. Export Map Document: H:\Finished Products\ GISCartography\GISCarto_map2_ndp.jpg
· GISCarto3
1. Followed Steps in Lab: GIS and Cartography
2. Layers Selected: Elevation and World Countries
3. Change Title: Mexico, Position
4. Add Data Source: UWF 2011
5. Legend: Adjust Style
6. Adjust Labeling of Elevation
7. Export Map Document: H:\Finished Products\ GISCartography\GISCarto_map3_ndp.jpg
· Lab Questions/Answers
Q1: How many columns and rows does mex_elev raster have?
A1: 3800, 2180
Q2: Can you edit the properties or data of an existing field?
A2: No
Q3: How many administrative divisions are selected?
A3: 32
Q4: Describe the difference between classified and stretched symbology schemes for raster datasets.
A4: The stretched has smoother lines and transitions. While classified is more pixeled.
No comments:
Post a Comment